
 Facebook
 Twitter
 Pinterest
 Copy Link


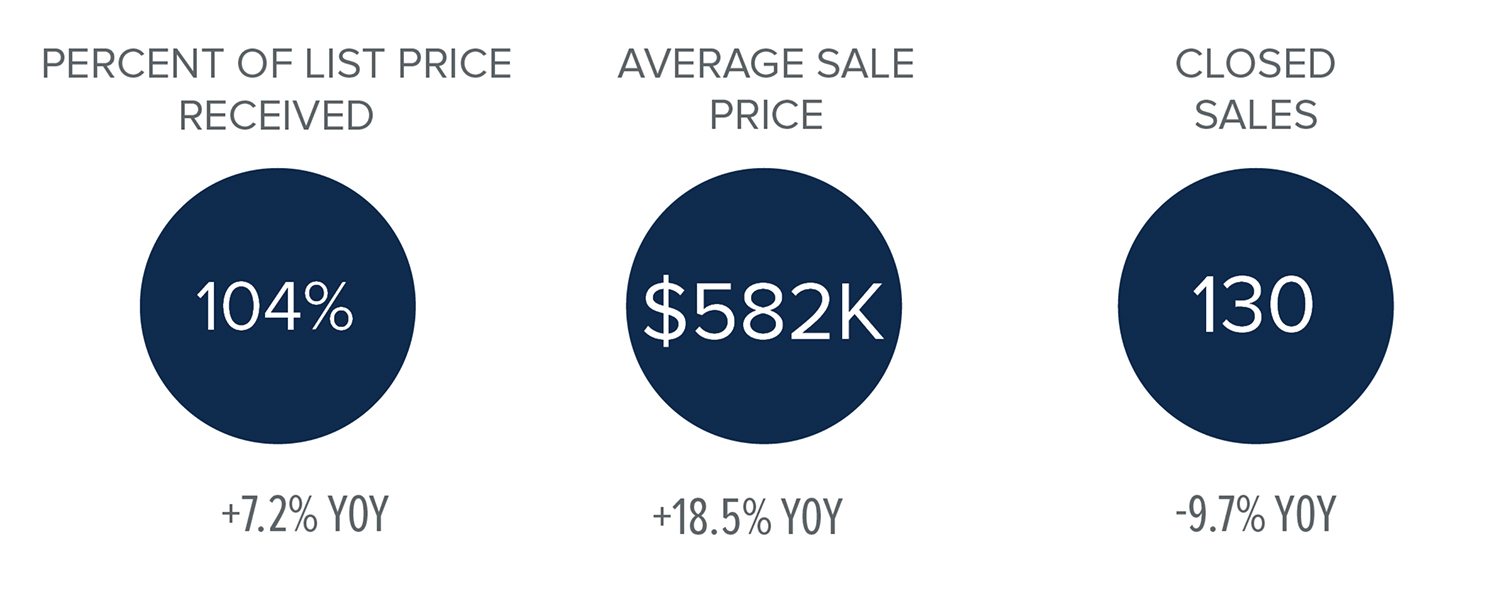
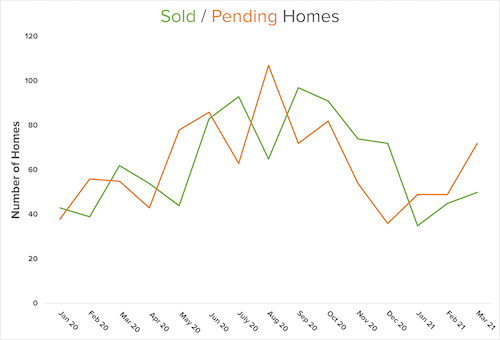

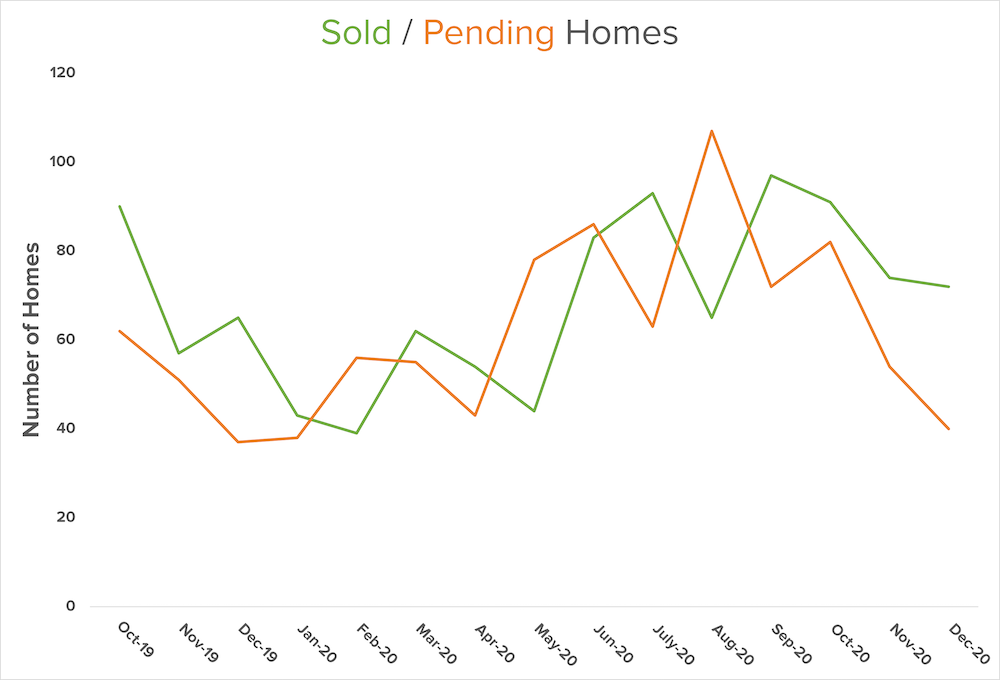
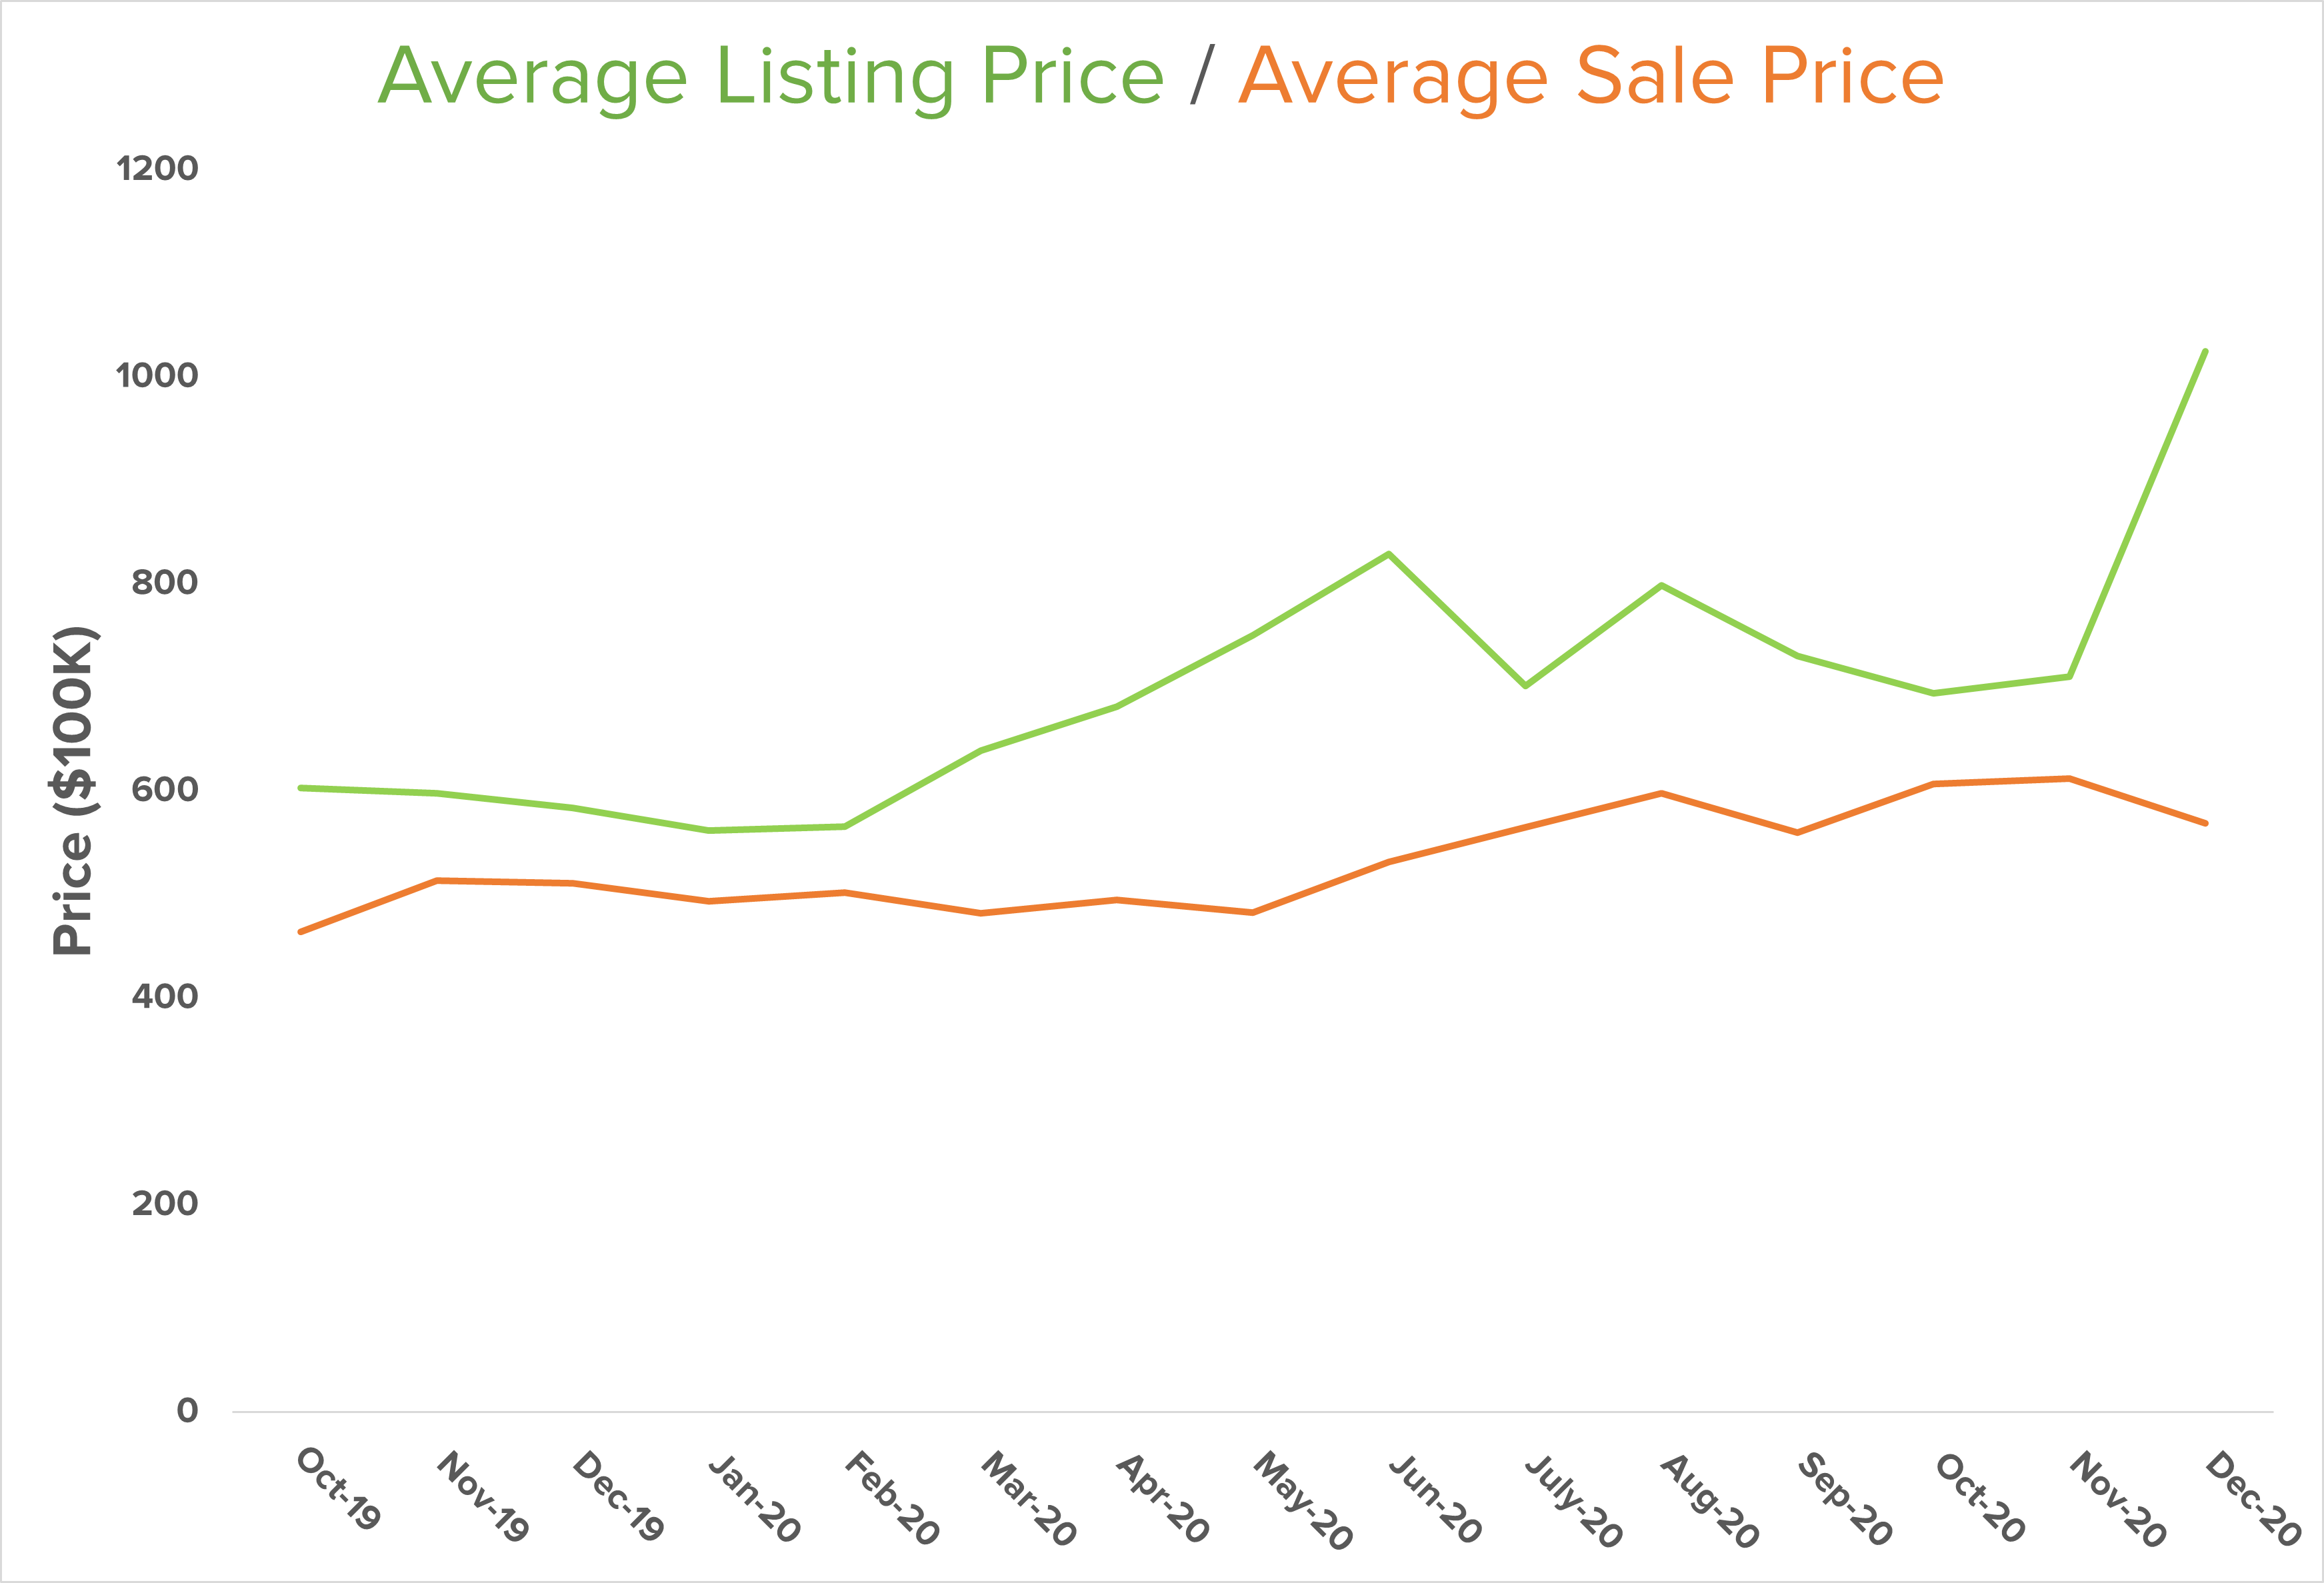
Our Strong Seller’s Market
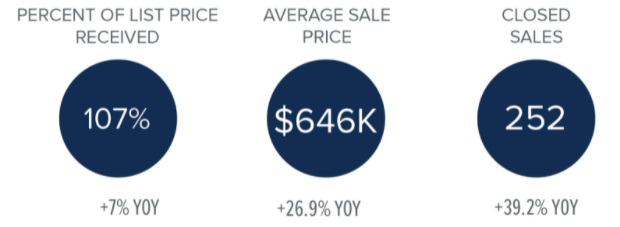
It’s a strong seller’s market here in North Kitsap. Inventory remains low while demand is high. In our third quarter, the median sale price was up 9% year-over-year at $508K. Buyers should be aware that multiple offer situations have become more common in our area. Our Brokers have seen an increase in situations where some buyers are outbid either by price or by an all-cash buyer.

Market Predictions
Although mortgage rates remain historically low and demand is high, our Chief Economist, Matthew Gardner, has some concerns about how this may impact real estate down the road. “We may be heading towards a period where we see houses turn over at a far slower pace as we stay in our homes for longer than ever…this could be a problem as it leads to persistently low levels of inventory for sale, which itself could lead to prices continuing to rise at above-average rates and that would further hit affordability.” As for mortgage rates, Gardner does not expect them to rise significantly any time soon. However, he says, “We should all be aware that there could be consequences to very low rates”.
Western Washington Review
Let’s zoom out a bit and look at our area. Below are highlights from The Western Washington Gardner Report provided by Windermere Real Estate’s Chief Economist, Matthew Gardner.
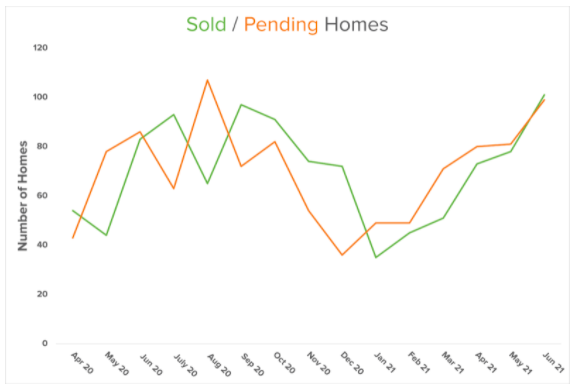
WESTERN WASHINGTON HOME SALES
- Total Sales: 11.6% increase from Q3/2019, and 45.9% higher than Q2/2020
- Homes for Sale: 41.7% lower than Q3/2019, but up 1.6% from Q2/2020
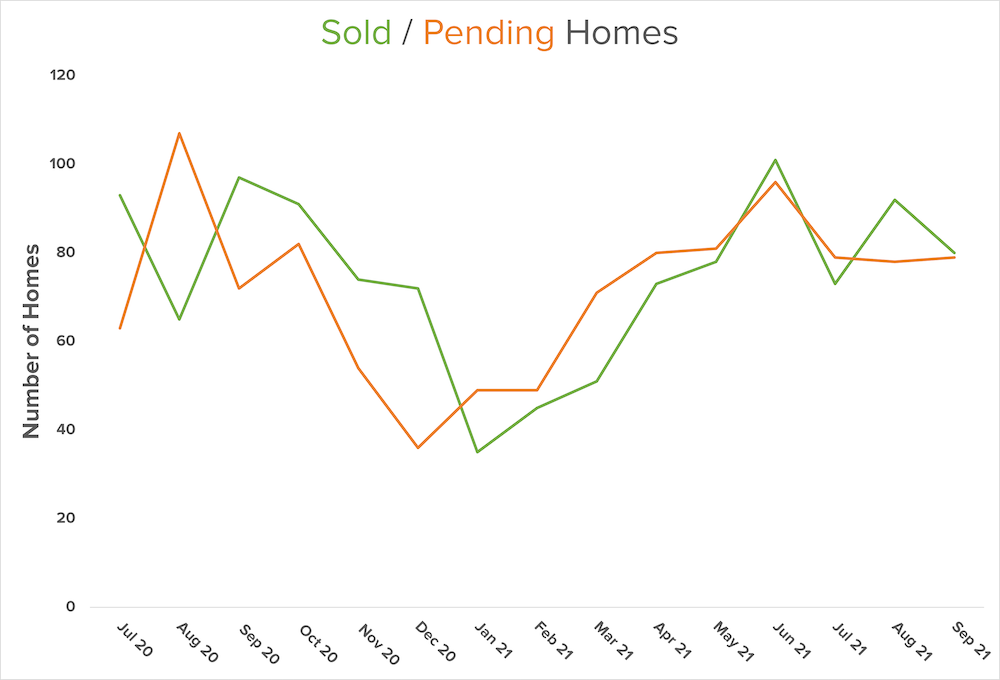
- Pending Sales: up 29% from Q2/2020
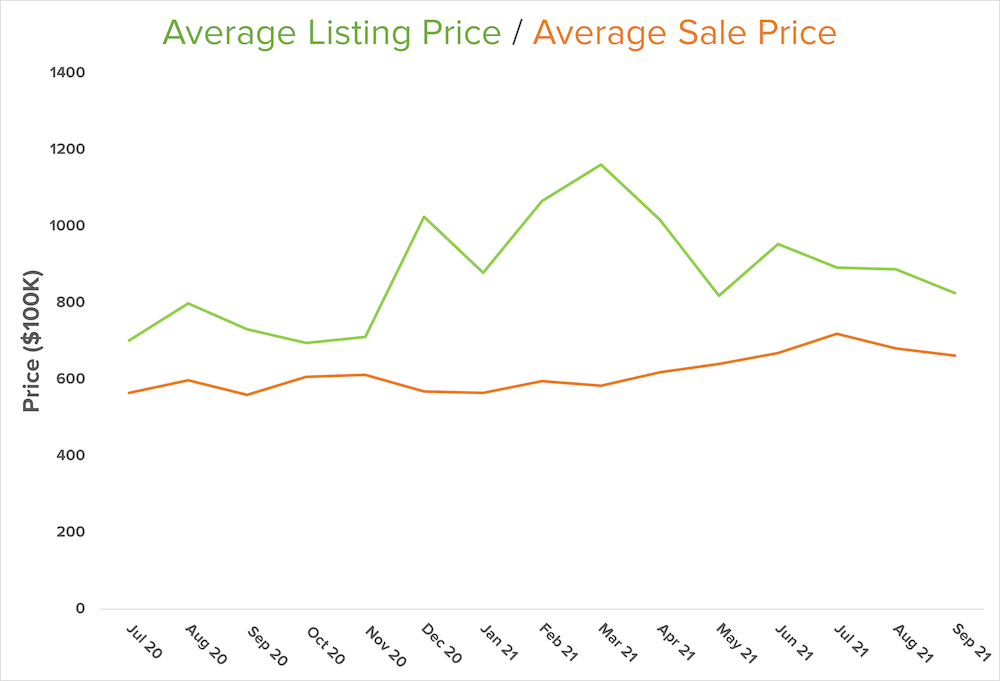
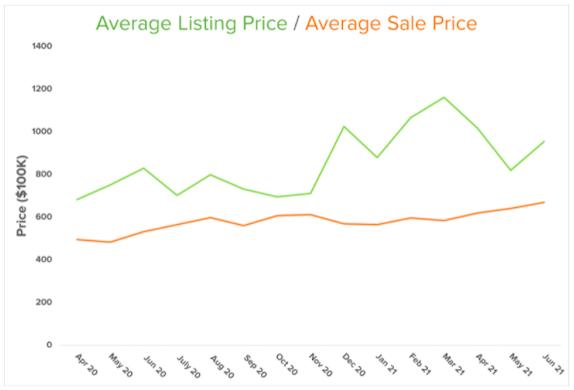
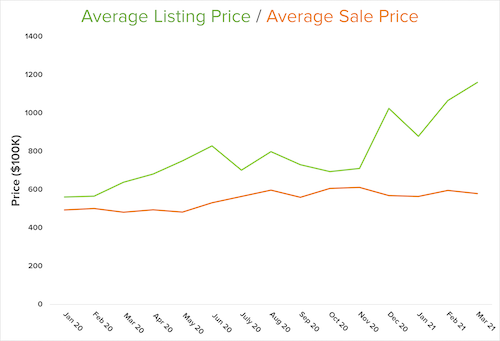
WESTERN WASHINGTON HOME PRICES
- Average: $611,793 (up 17.1% from Q3/2019). Low mortgage rates and limited inventory are clearly pushing prices up.
- Prices will continue to increase as long as mortgage rates and inventory levels stay low. If this continues to be the case, affordability issues will become more apparent in many markets.
DAYS ON MARKET, WESTERN WASHINGTON
- Average: 36 days (an average of 4 fewer days than in Q2/2020 and 2 fewer days than in Q3/2019)
- In Kitsap County, average days on market: 20
Conclusion
In Gardner’s Western Washington Report, he states that, although we have a strong seller’s market that is very buoyant, he’s “starting to see affordability issues increase in many areas—not just in the central Puget Sound region—and this is concerning. Perhaps the winter will act to cool the market, but something is telling me we shouldn’t count on it.”
